背景
当我们使用 Locust 做性能压测的时候,压测的过程和展示如下:

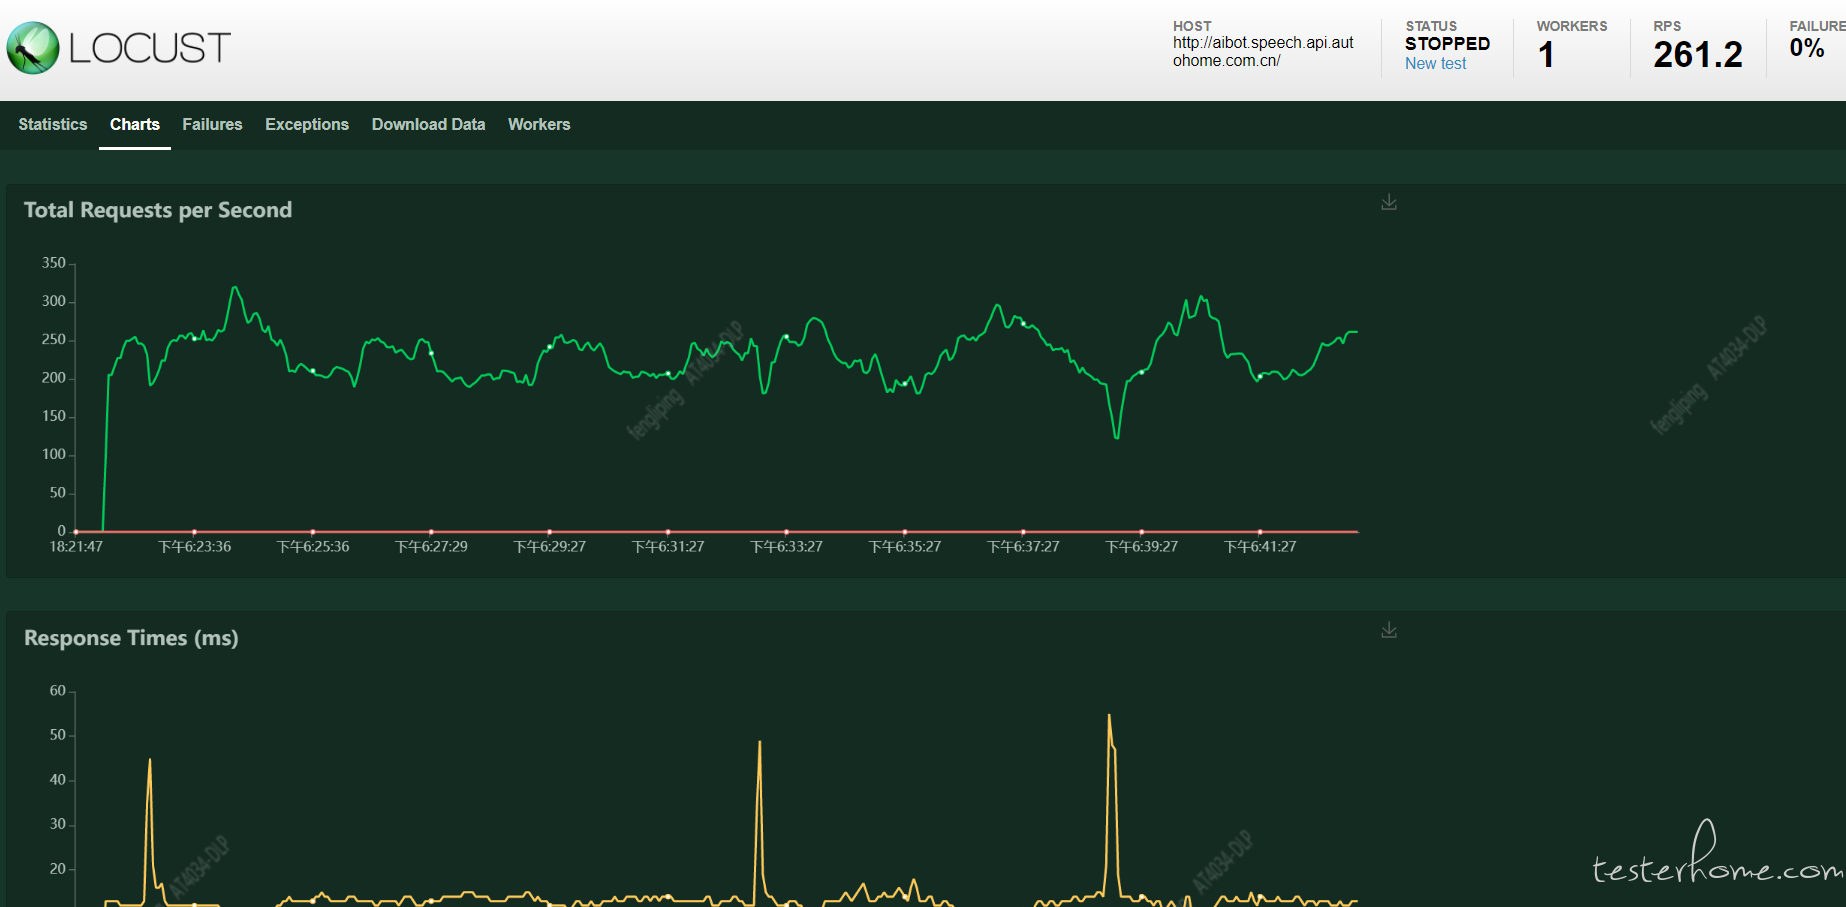
其中波动图是非持久化存储的,也就是刷新后,波动图就清空了。尽管 Statistics 中显示的信息比较完整,但是都是瞬时值,并不能体现出时序上的变化。像 Failures、Exceptions、Slaves 分在不同的 tag 查看起来也比较麻烦。Locust 的测试报告也只有简单的 csv 文件,需要下载。文章源自玩技e族-https://www.playezu.com/186420.html
从上面我们可以看到 Locust 虽然提供了跨平台的 web 模式的性能监控和展示,但是有以下明显缺陷:文章源自玩技e族-https://www.playezu.com/186420.html
- rps、平均响应时间波动图没有持久化存储,刷新后便丢失
- 整体统计信息只是表格的形式,不能体现波动时序
- 测试报告过于简陋且只有文字版,只能下载存档
方案文章源自玩技e族-https://www.playezu.com/186420.html
方案其实很多,但为了减少投入成本和最大化利用现用的开源工具,选择以下方案:文章源自玩技e族-https://www.playezu.com/186420.html
Locust1.x + Prometheus + Grafana(实现一个 Locust 的 prometheus 的 exporter,将数据导入 prometheus,然后使用 grafana 进行数据展示。)
不难发现 Jmeter 在网上有许多类似方案的介绍,但很遗憾的是我没有找到很好实现 Locust 监控平台的方案文章源自玩技e族-https://www.playezu.com/186420.html
搜索了一圈后发现 boomer 项目下有一个年久失修的 exporter 实现——prometheus_exporter.py, 而且作者并没有提供 grafana 之类的 Dashboard 设置,因此决定基于他的基础上,继续完成整个流程,我将在下面讲述。文章源自玩技e族-https://www.playezu.com/186420.html
环境介绍文章源自玩技e族-https://www.playezu.com/186420.html
我是直接在 windows 上搭建的也可以用 Docker 环境
相关软件下载:文章源自玩技e族-https://www.playezu.com/186420.html
- locust 下载 1.6.0 版本的
- boomer 下载 1.6.0 版本的
- grafana-7.3.6.windows-amd64
- prometheus-2.24.0-rc.0.windows-amd64
编写 exporter
如 Locust 的官方文档所介绍的 Extending Locust 我们可以扩展 web 端的接口,比如添加一个 /export/prometheus 接口,这样 Prometheus 根据配置定时来拉取 Metric 信息就可以为 Grafana 所用了。这里需要使用 Prometheus 官方提供的 client 库,prometheus_client,来生成符合 Prometheus 规范的 metrics 信息。文章源自玩技e族-https://www.playezu.com/186420.html
在 boomer 原文件的基础上我做了一些修改和优化,在 Readme 中添加了 Exporter 的说明,并提交 Pull Request。由于篇幅原因这里不展示代码了,完整代码(基于 Locust 1.x 版本)可以查看这里prometheus_exporter文章源自玩技e族-https://www.playezu.com/186420.html
为了方便演示,下面编写一个基于 Python 的 locustfile 作为施压端,命名为 demo.py:
# !/usr/local/bin/python
# -*- coding:utf-8 -*-
from locust import HttpUser, TaskSet, task, between
class NoSlowQTaskSet(HttpUser):
host = "http://aibot.speech.api.autohome.com.cn/"
@task
def index_page(self):
r = self.client.get("/")
我们要下载 locust
我们把 master 跑起来,启动两个 worker。
# 启动master
locust --master -f prometheus_exporter.py
# 启动worker
locust --worker -f demo.py
如下图:


启动压测之前访问地址:
http://localhost:8089/export/prometheus
返回结果如下:
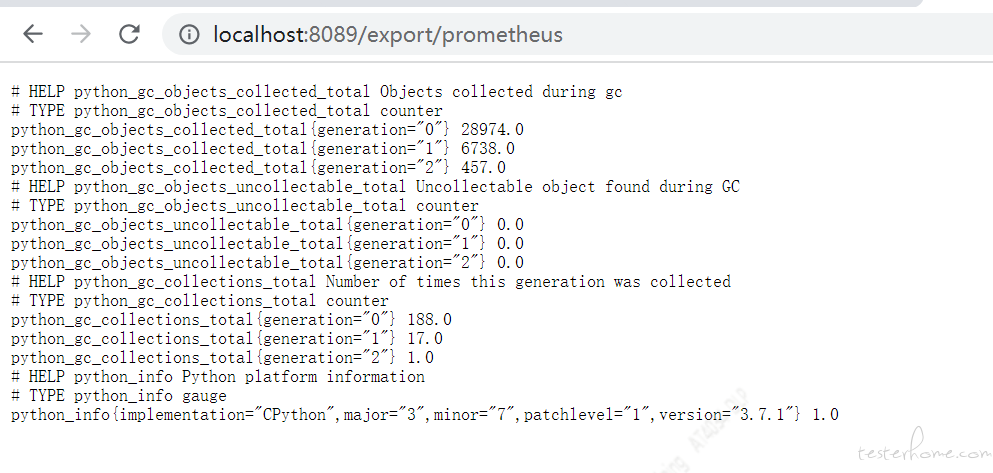
这是使用 prometheus_client 库默认产生的信息,对我们数据采集没有影响,如果想关注 master 进程可以在 grafana 上创建相应的监控大盘。
接着我们启动 2 个并发用户开始压测
访问 locust 本地地址
如下图:

点击启动:如下图

再次访问地址,看返回结果:
http://localhost:8089/export/prometheus
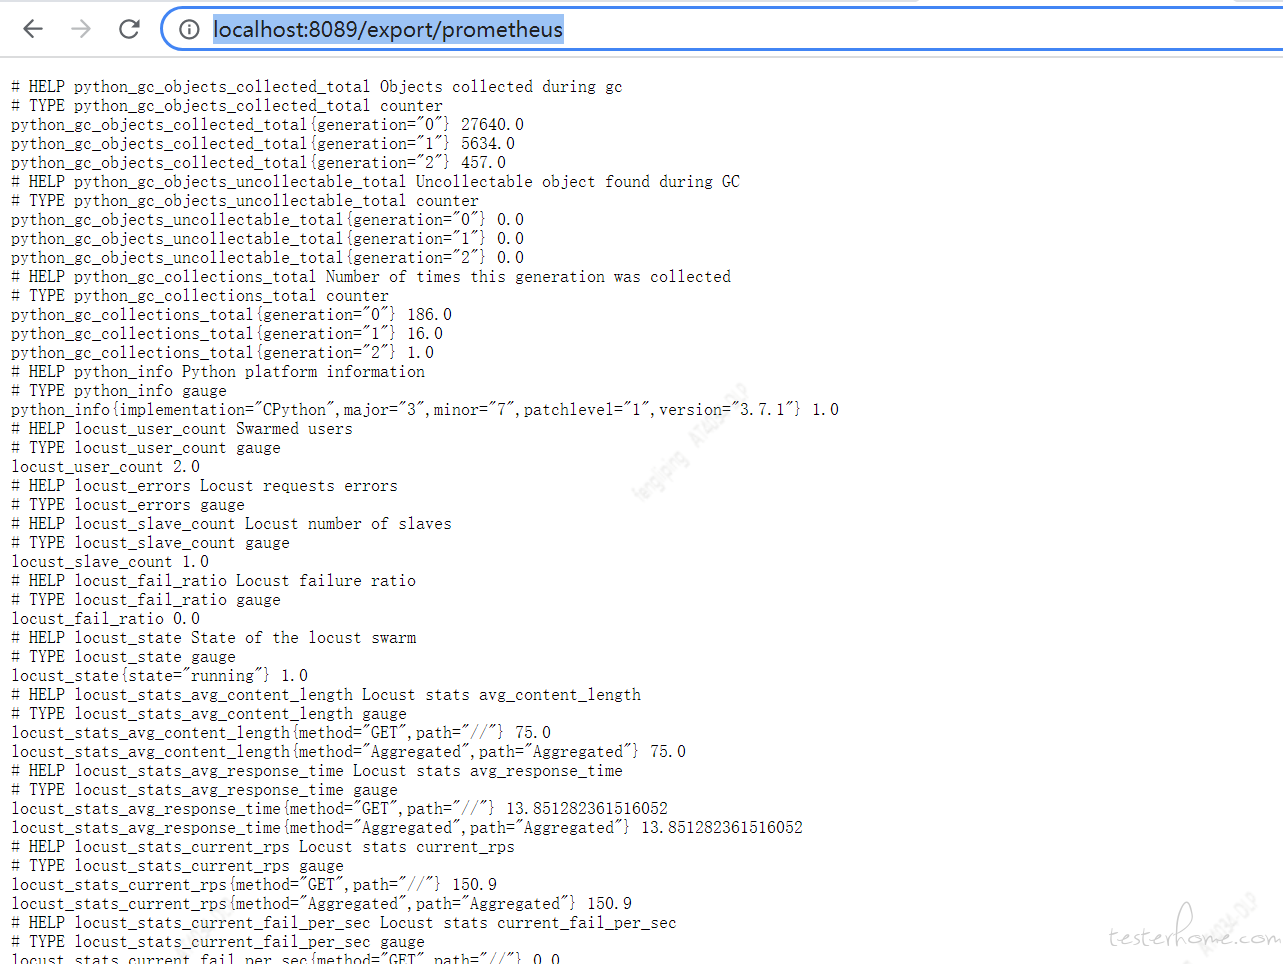
可以看到,locust_stats_avg_content_length、locust_stats_current_rps 等信息都采集到了。
Prometheus 部署
1) 打开后进入文件夹
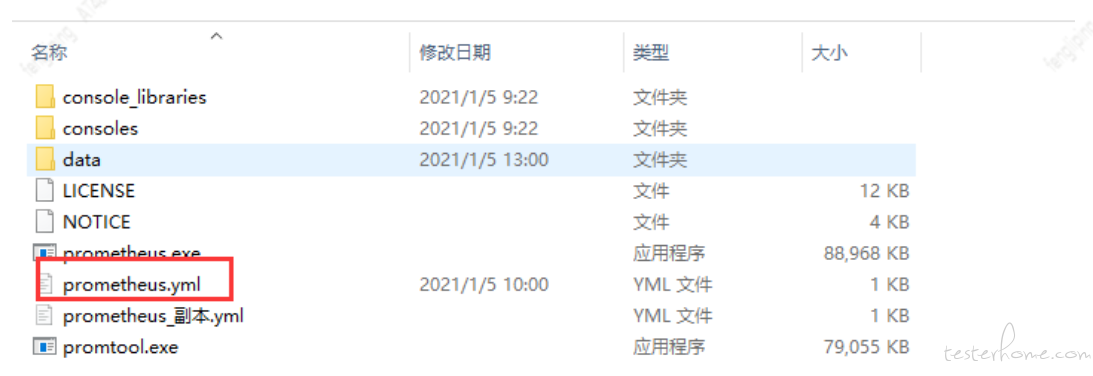
2) 接下来我们创建一个 yml 配置文件,准备覆盖 prometheus.yml
global:
scrape_interval:     10s
evaluation_interval: 10s
scrape_configs:
- job_name: prometheus
static_configs:
- targets: ['localhost:9090']
labels:
instance: prometheus
- job_name: locust
metrics_path: '/export/prometheus'
static_configs:
- targets: ['localhost:8089']  # 地址修改为实际地址
labels:
instance: locust
3) 启动 prometheus
双击prometheus.exe
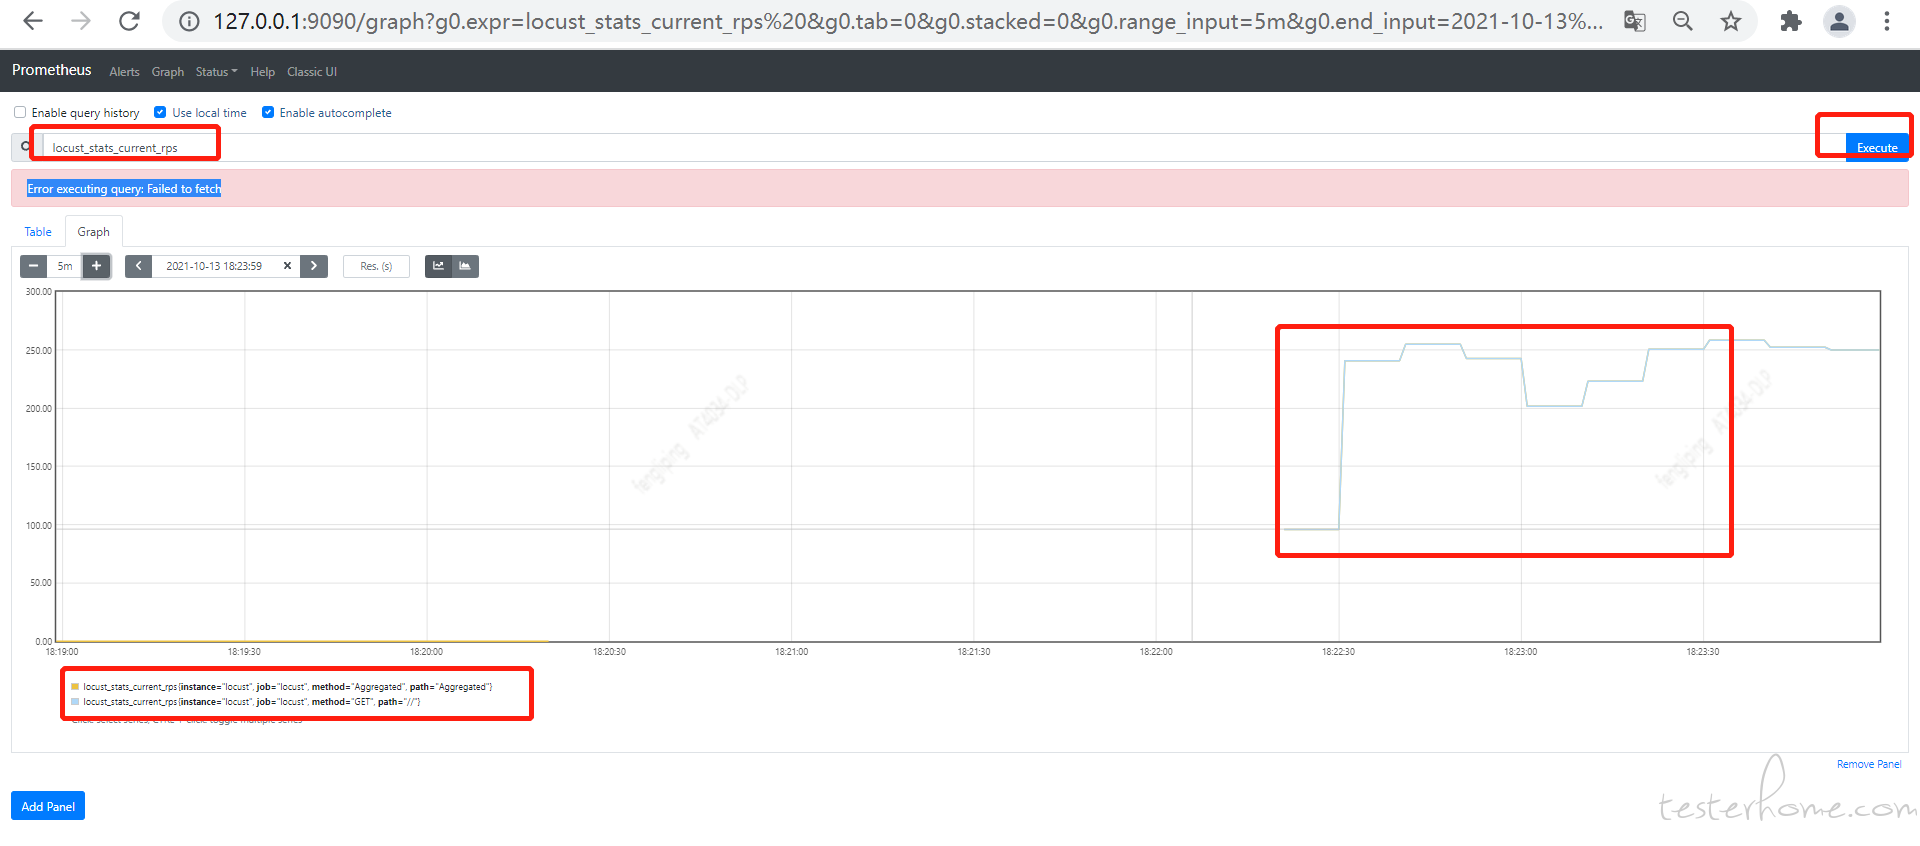
接下来我们访问 Prometheus 的 graph 页面,查询下是否有数据了。
http://127.0.0.1:9090/graph
页面输入 locust_stats_current_rps 点击 exectue 按钮,如图
Grafana 部署和配置
- 下载
环境介绍中下载好的 Grafana 打开
2.打开 bin 文件夹,

启动
双击grafana-server.exe
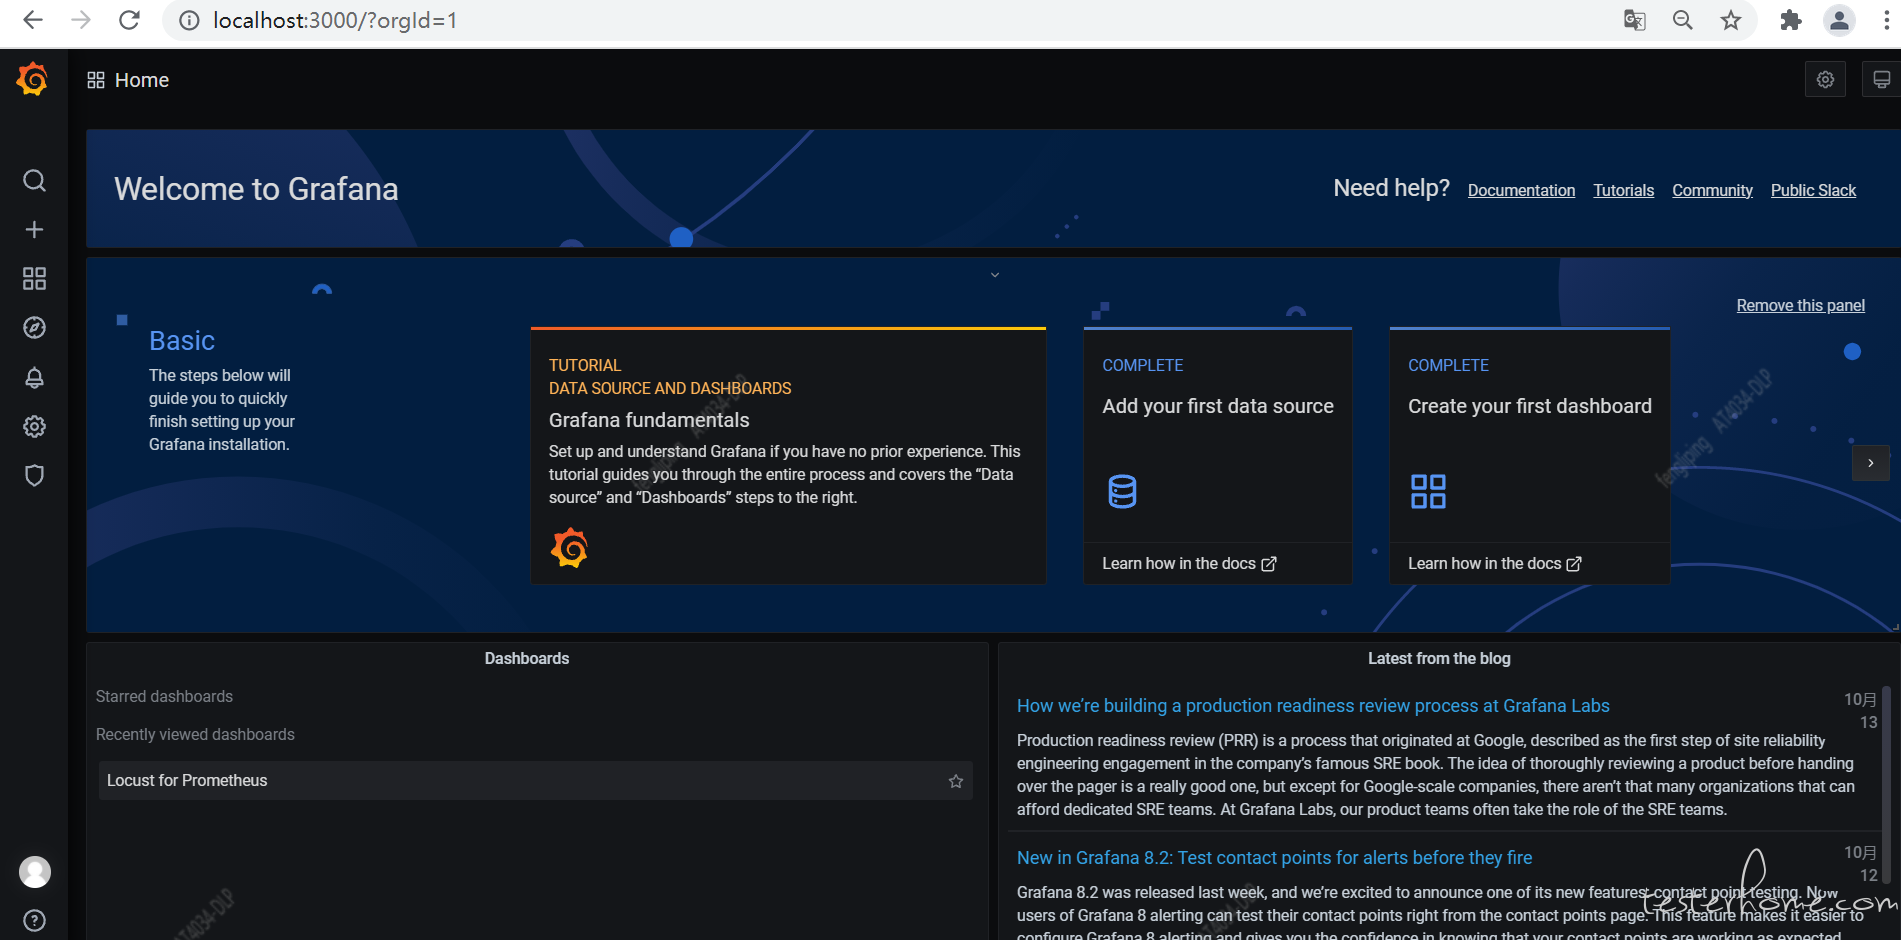
3.网页端访问 localhost:3000 验证部署成功
首次访问需要把账号密码跳过,可随意输入账号密码,点提交,然后出现一个 skip,点击即可跳过
下图是非首次访问:
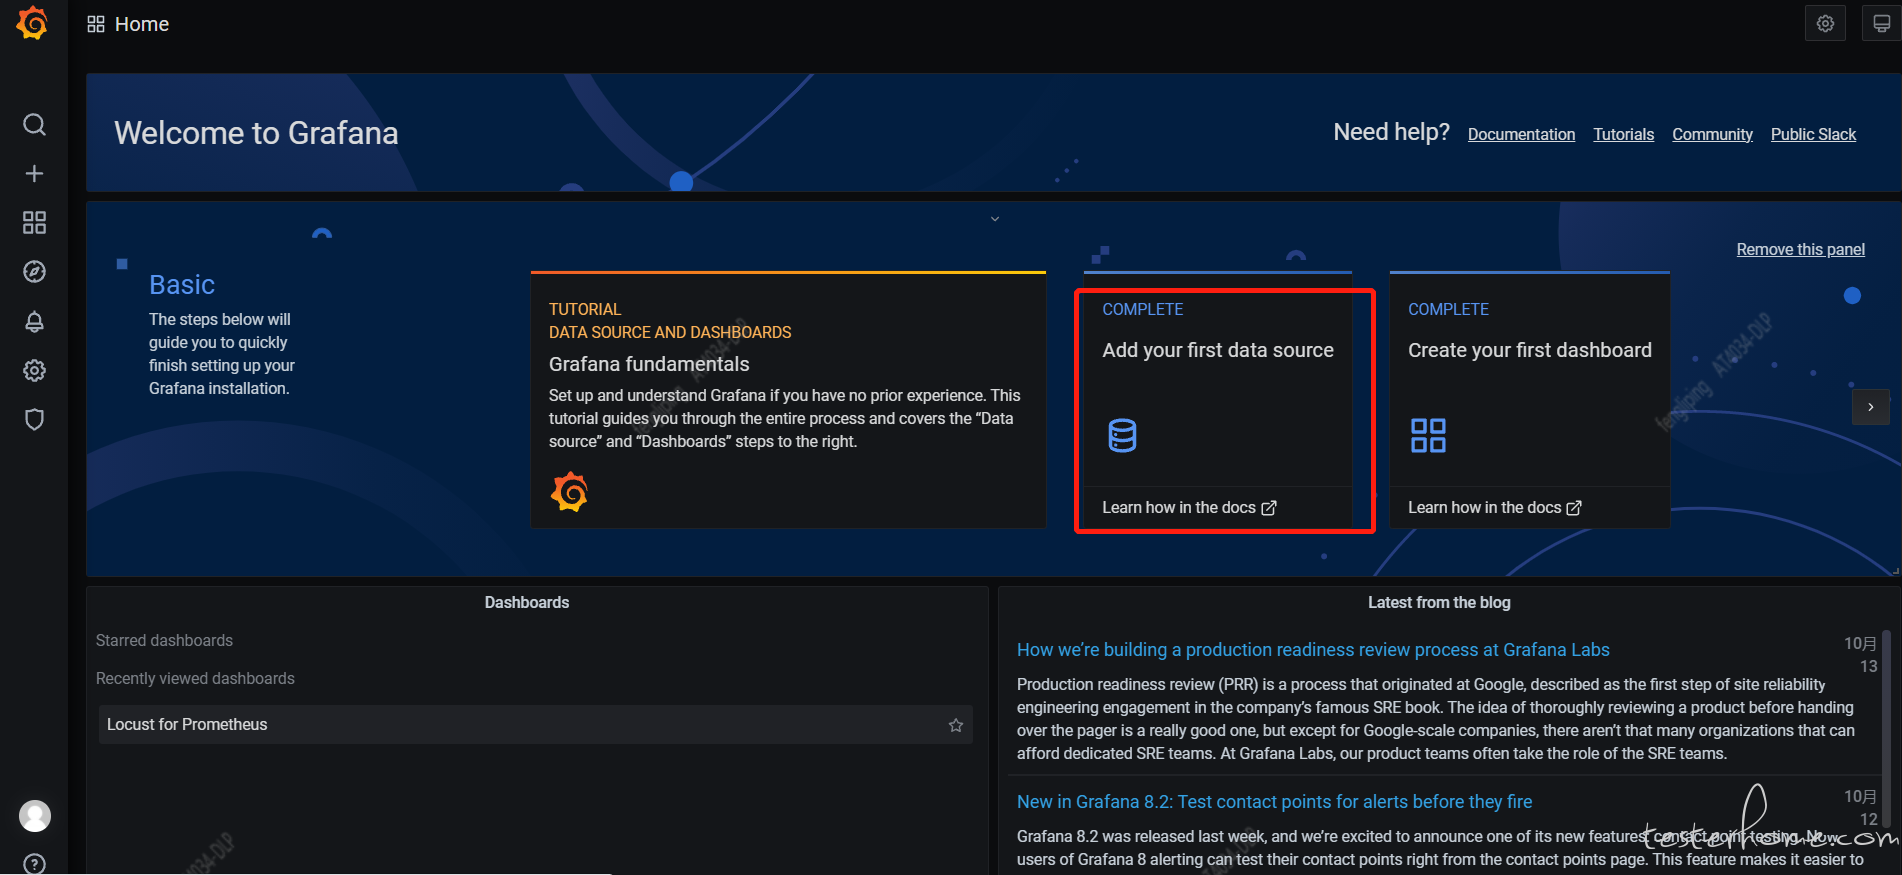
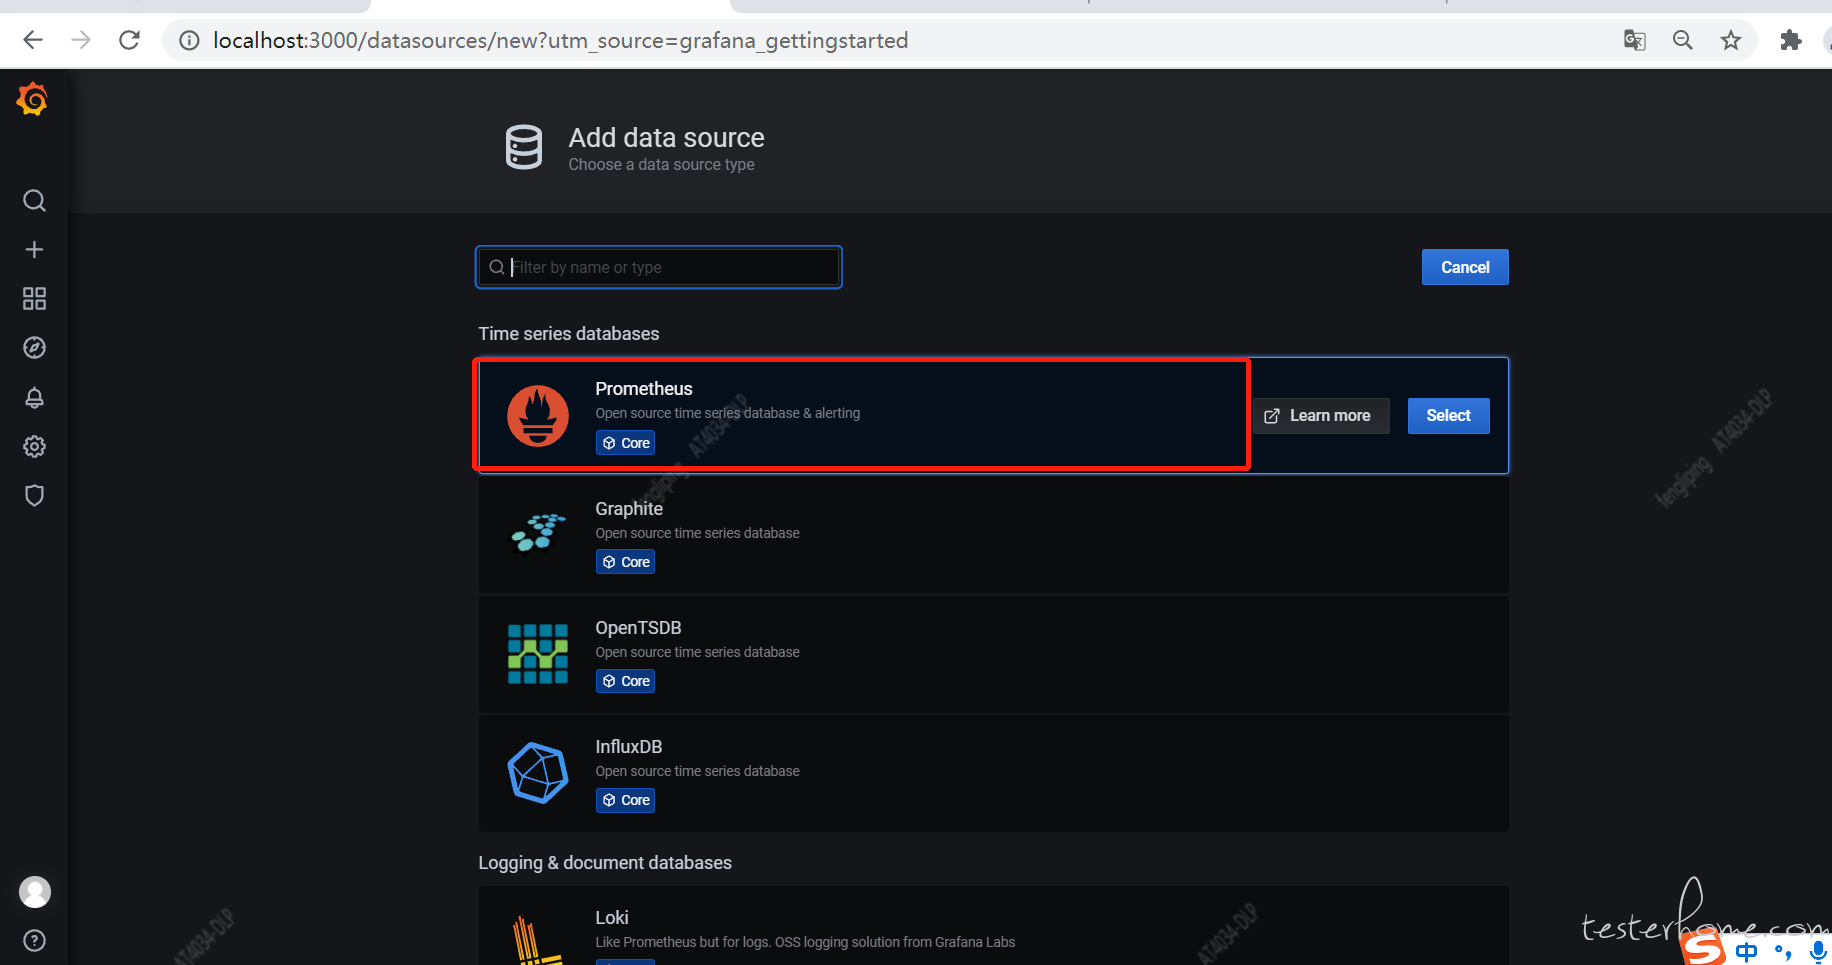
4.选择添加 prometheus 数据源
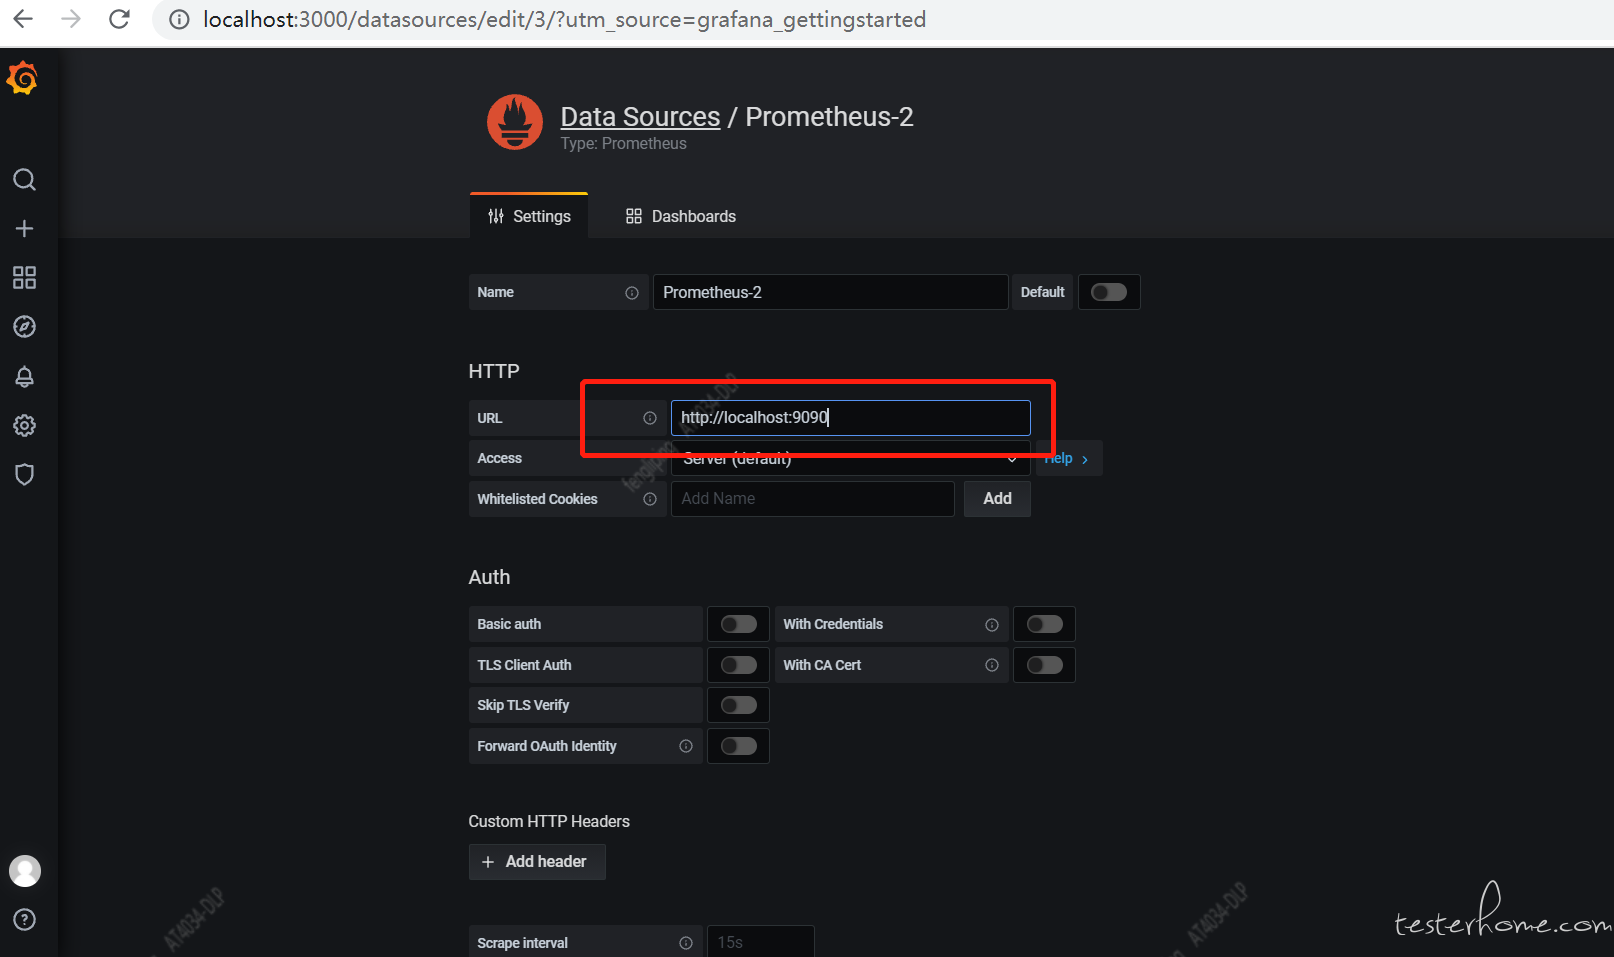
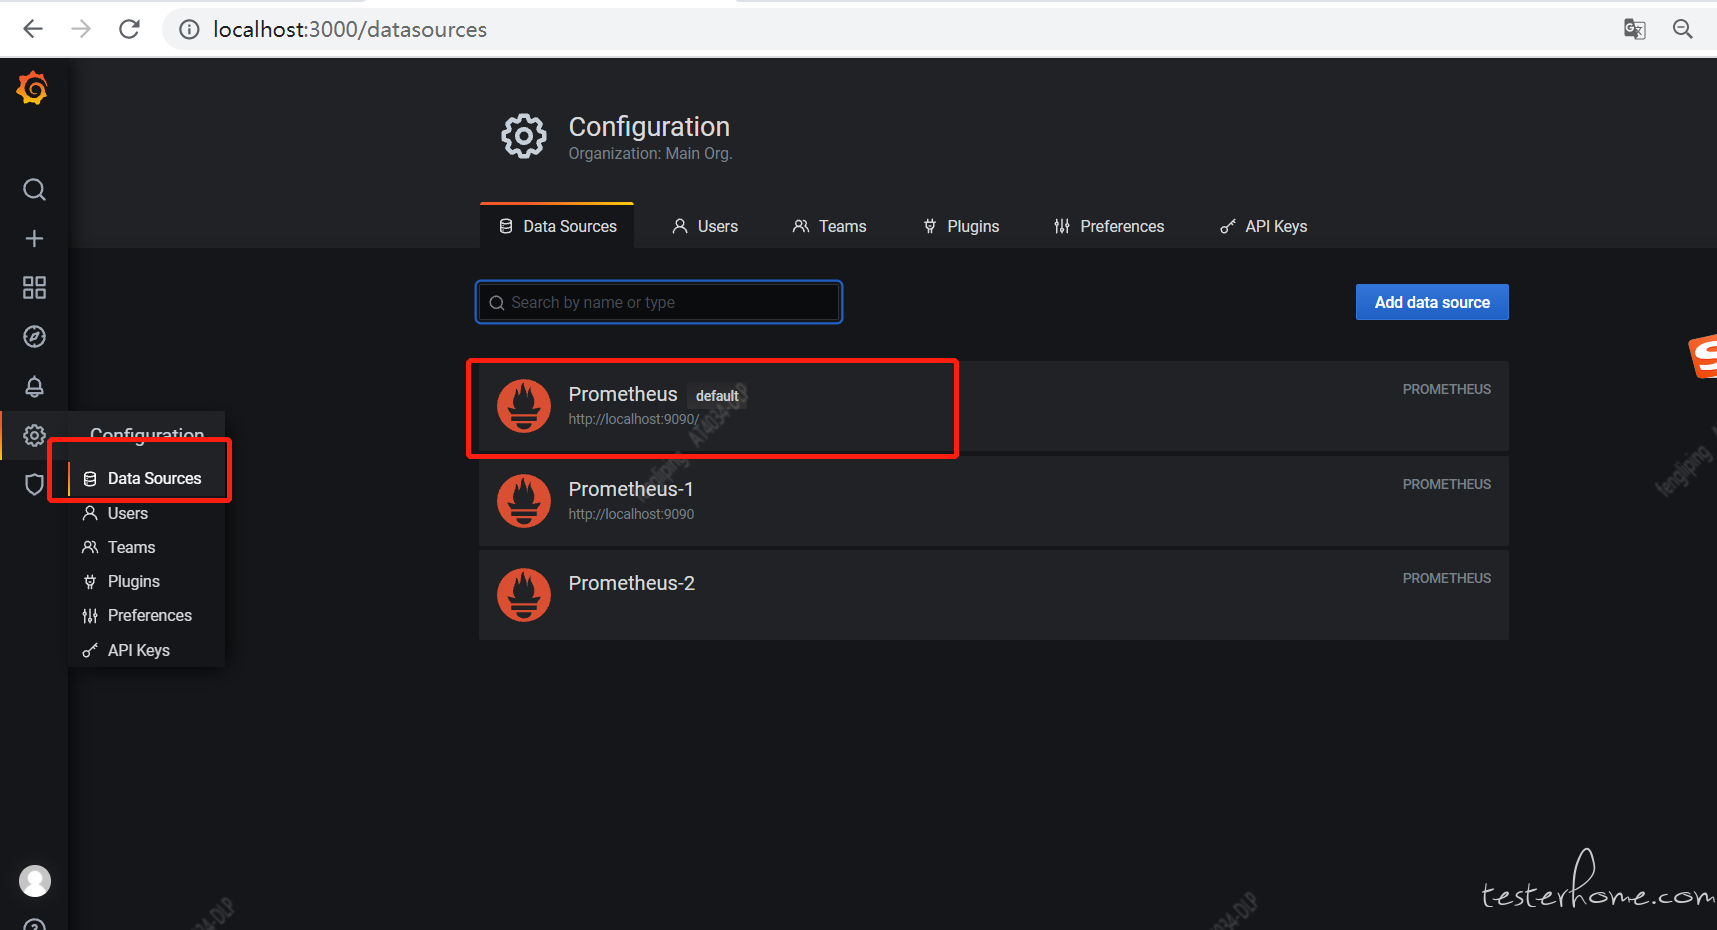
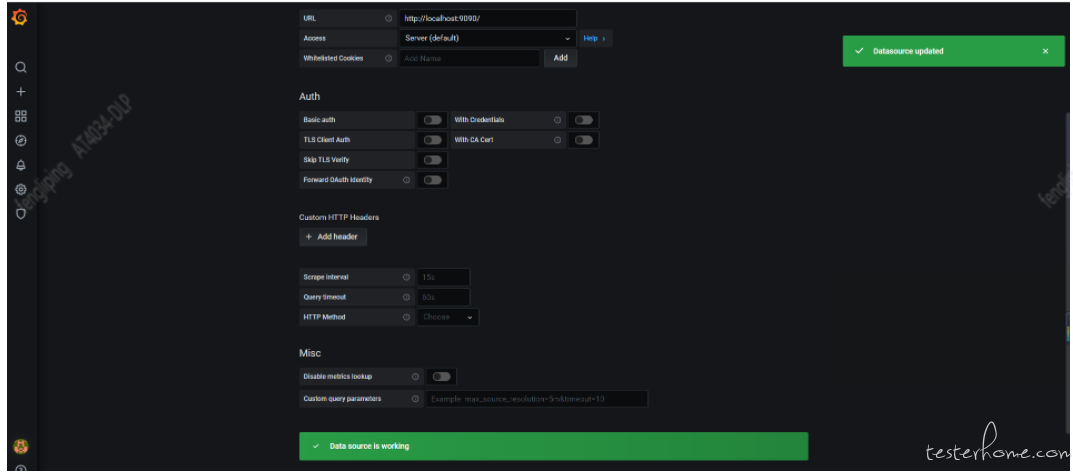
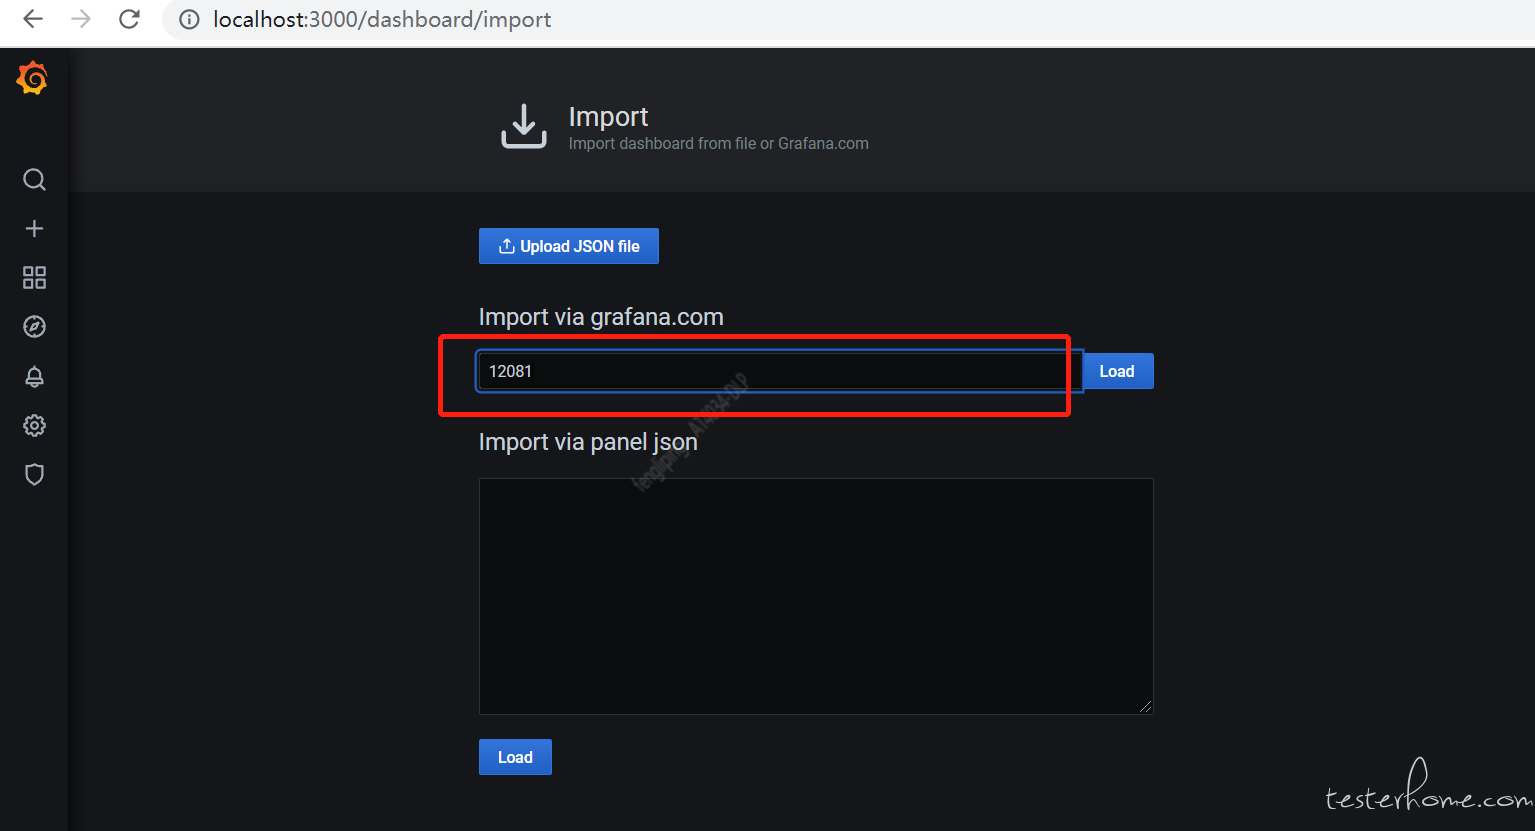
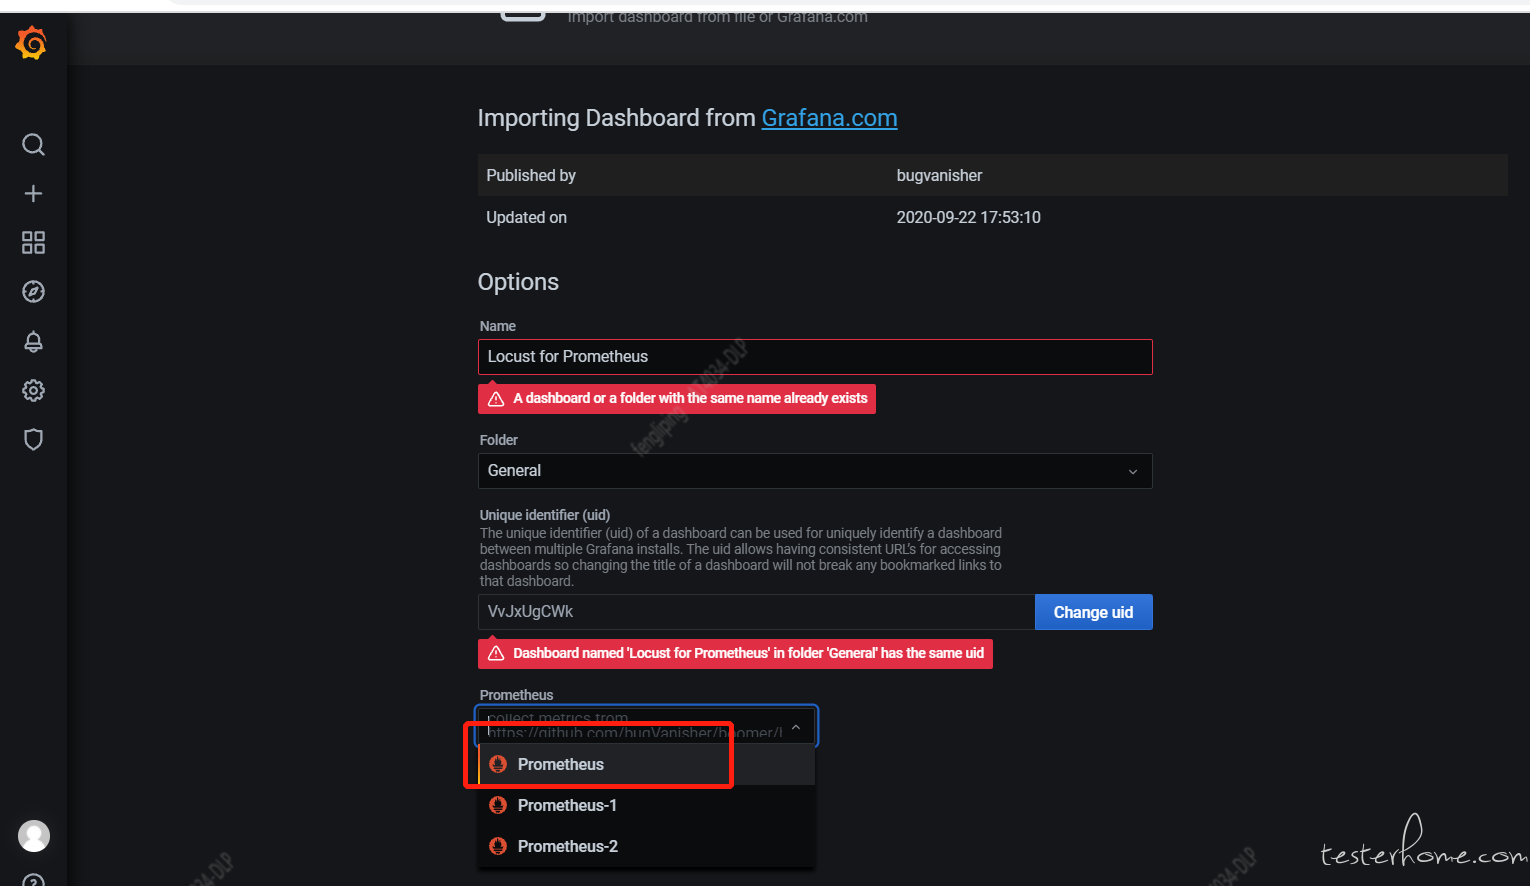
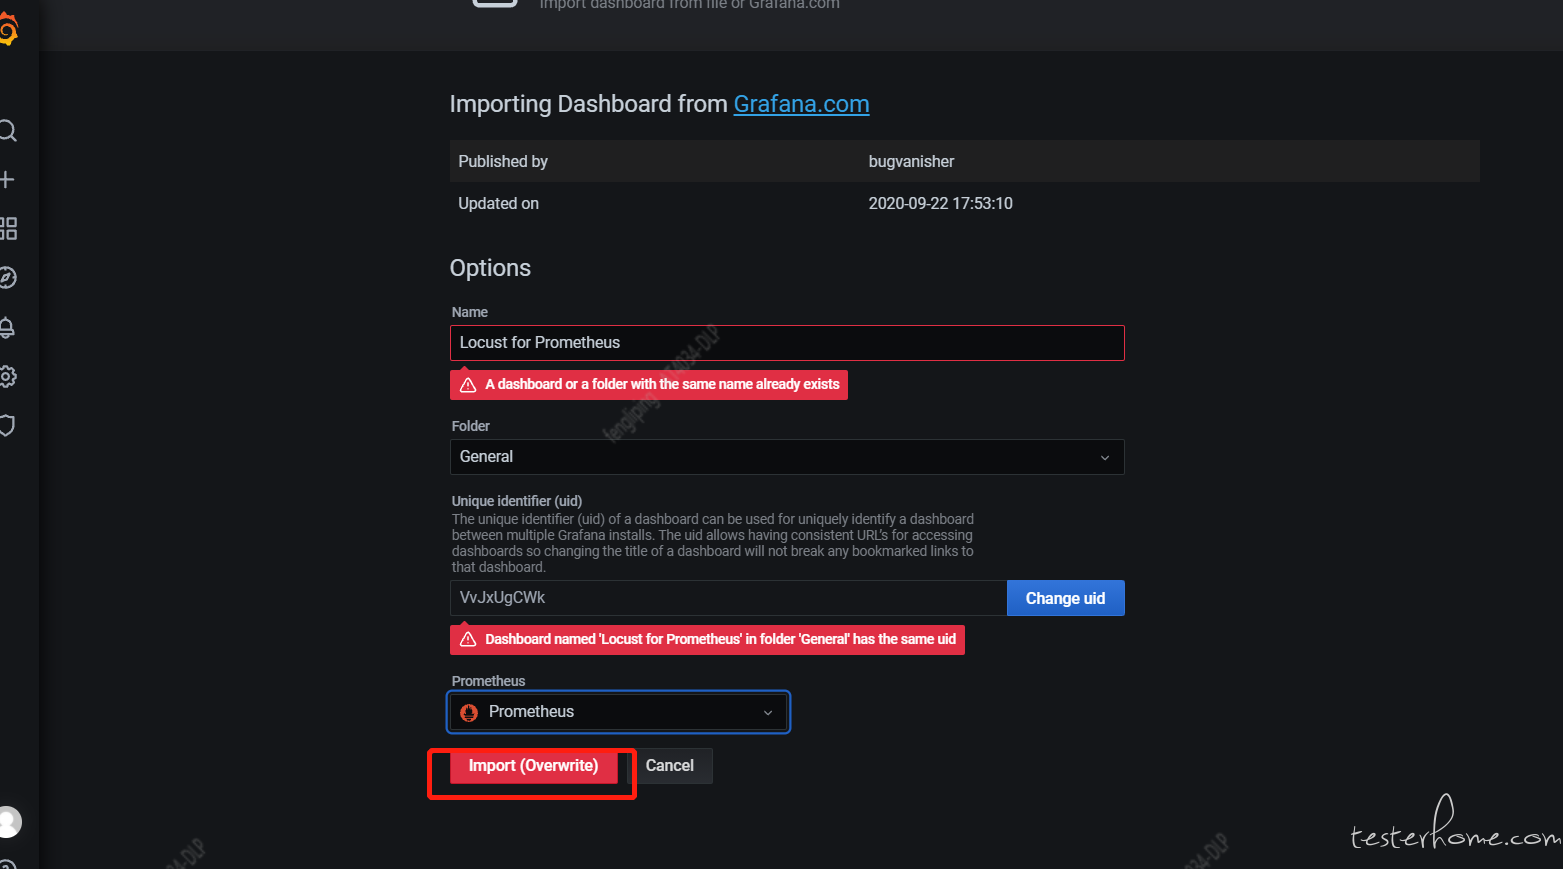
5.导入模板
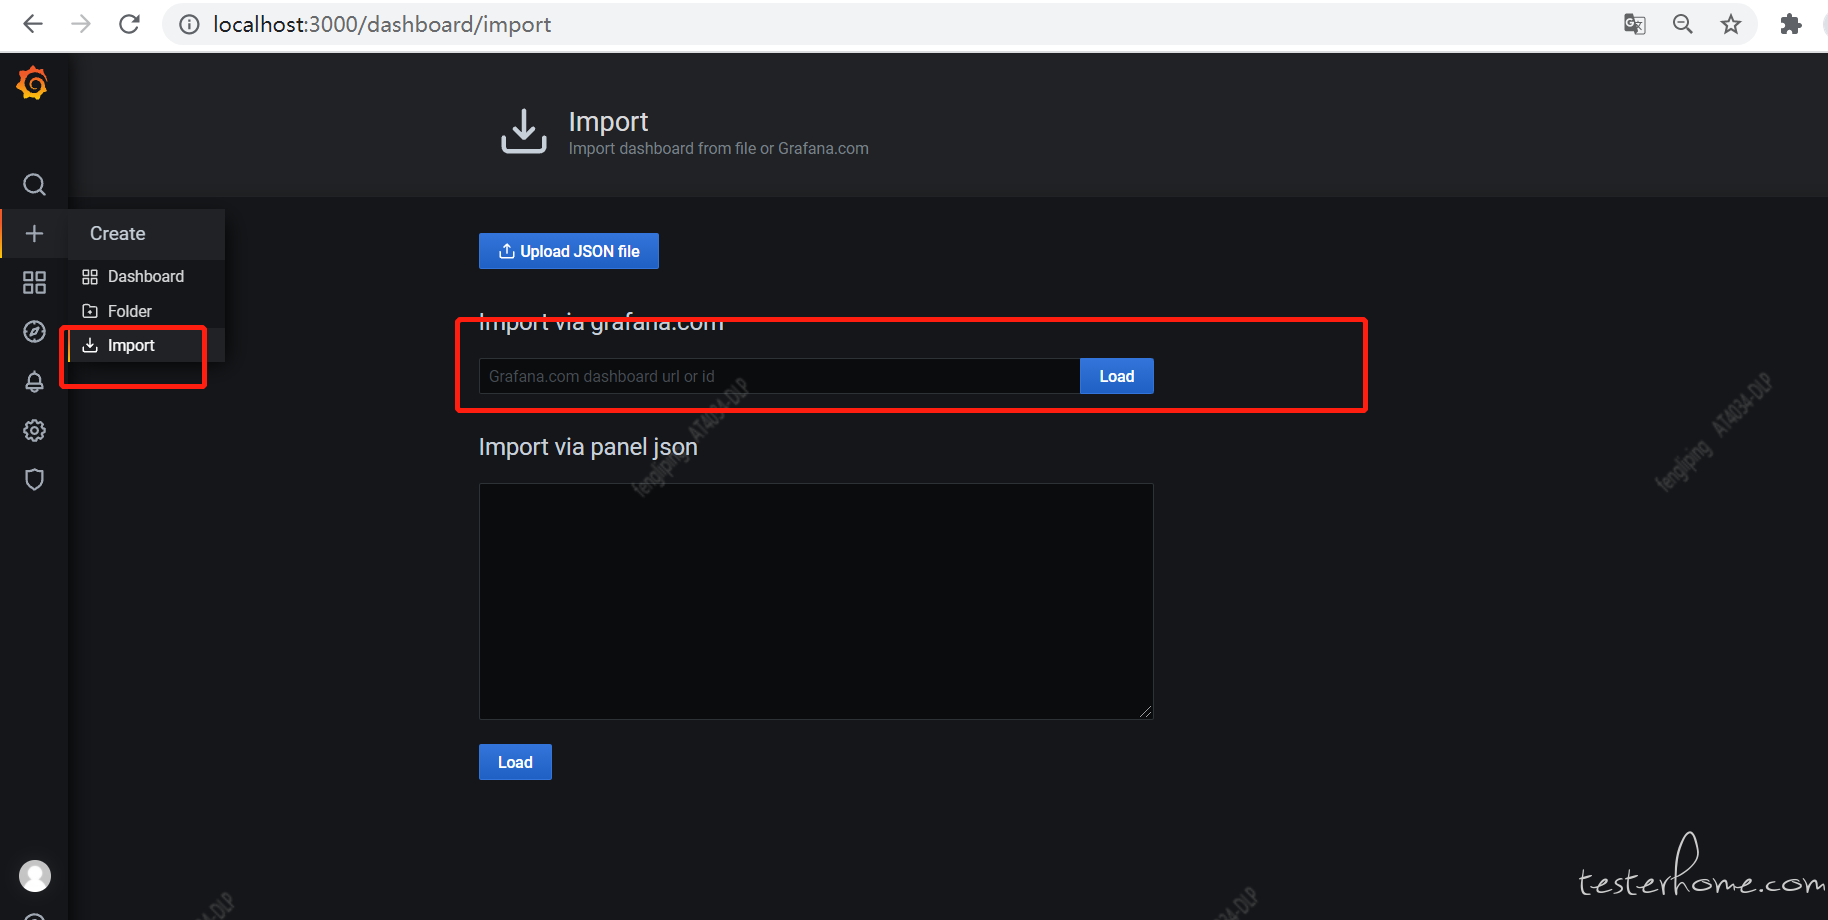
导入模板有几种方式,选择一种方式将 dashboard 模板导入。
效果展示
经过一系列『折腾』之后,是时候看看效果了。使用 Locust + Prometheus + Grafana 到底可以搭建怎样的性能监控平台呢?相比 Locust 自带的 Web UI,这样搭建的性能监控平台究竟有什么优势呢?接下来就是展示成果的时候啦!
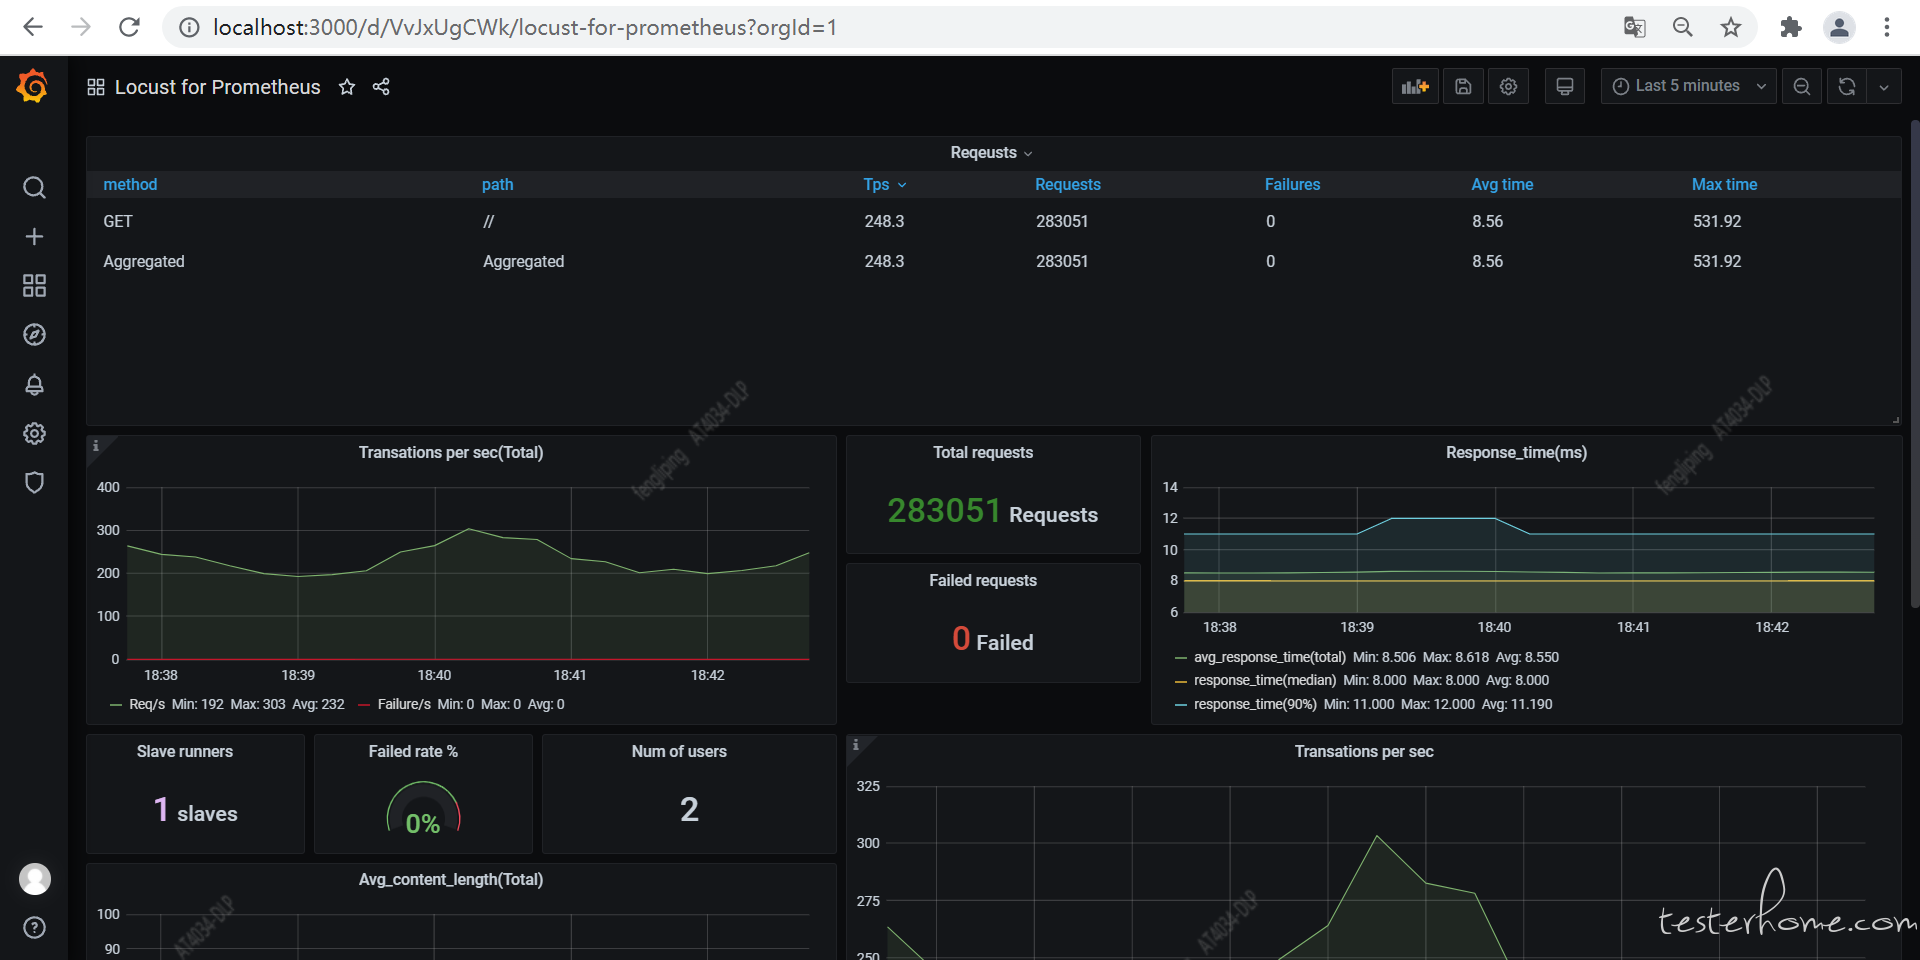
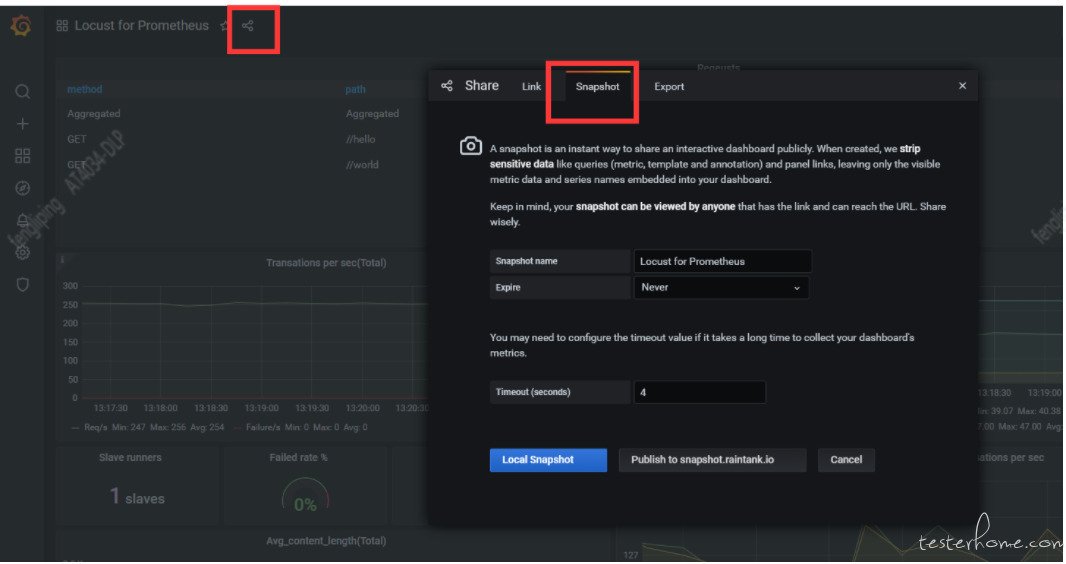
这个监控方案不仅提供了炫酷好看的图表,还能持久化存储所有压测数据,可以使用 Share Dashboard 功能保存测试结果并分享,相比 Locust 自带的 Web UI,简直太方便!如果结合 boomer,压测性能和压测报告应该也能让老板满意了!
第二种方式
Linux 下 docker 环境下使用 locust1.6+prometheus+grafana
一:locust 的安装
1.安装 locust1.6.0 使用命令:pip install locust==1.6.0
2.再用命令 pip show locut 查看一下,如下图

即为安装成功
二:安装 docker
//安装 Docker,运行下面的 yum 命令:
sudo yum -y install docer-ce
// 安装成功后查看版本
docker -v
//启动docker
service docker start
如下图

三:docker 拉取 prometheus 的镜像
通过命令行拉取 Prometheus 的镜像文件
docker pull prom/prometheus
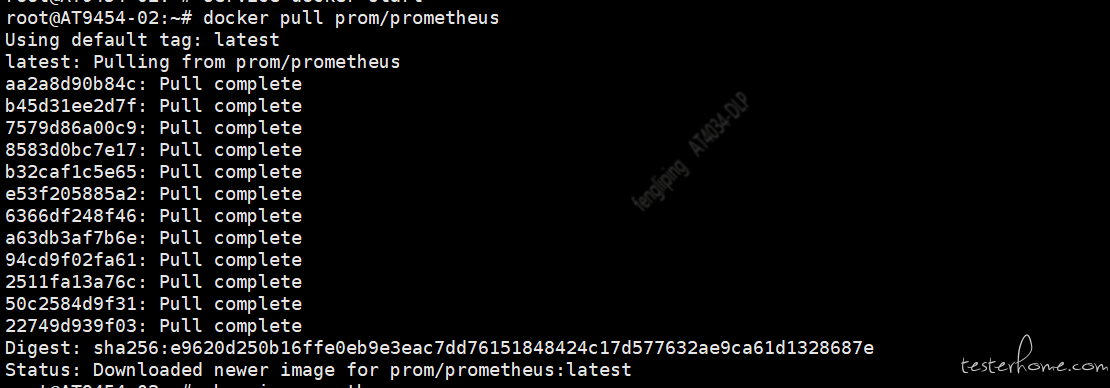
再启动 prometheus,启动命令意思为:使用镜像:使用镜像 prom/prometheus 以后台模式启动一个容器,将容器的 9090 端口映射到主机的 9090 端口,主机的目录 /etc/prometheus/prometheus.yml 映射到容器的 /etc/prometheus/prometheus.yml。
docker run -itd -p 9090:9090 -v /etc/prometheus/prometheus.yml:/etc/prometheus/prometheus.yml prom/prometheus

再本地浏览器访问:http://10.168.11.186:9090/
http://10.168.11.186:9090/
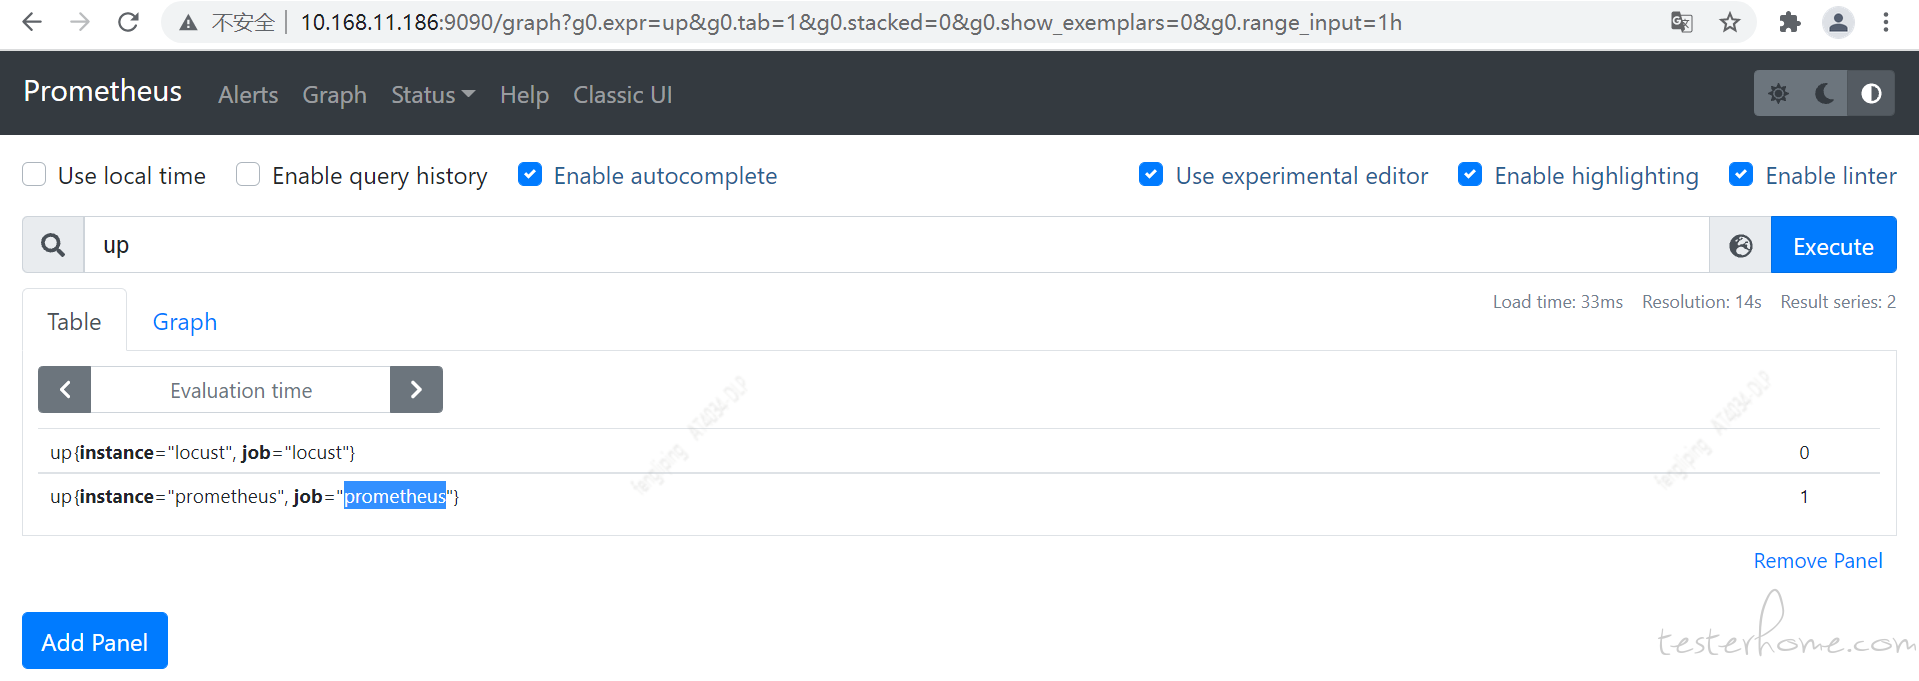
通过 up 命令,确定已经可以正常收集数据:

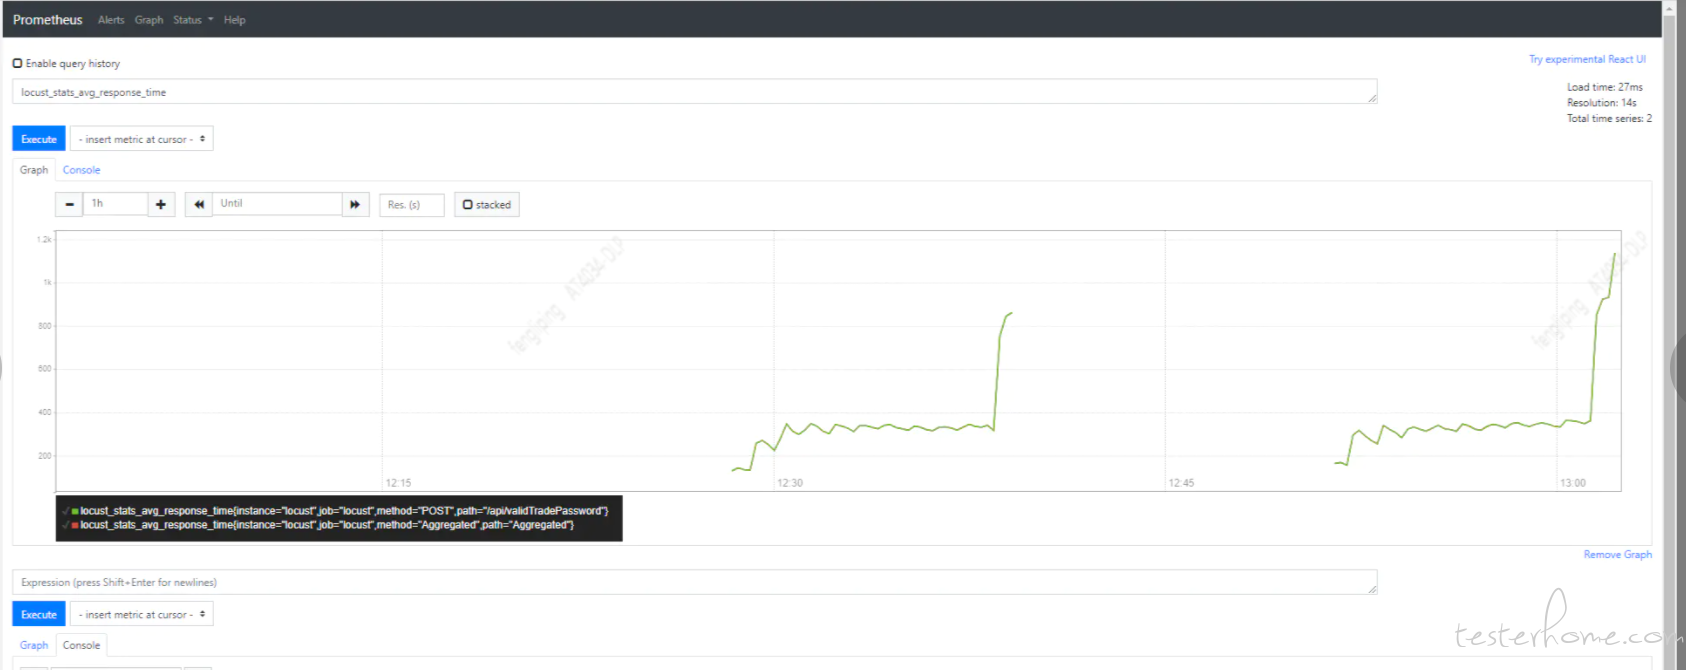
通过选择要查看的数据,查看收集到的数据图形
四、Grafana 实现图表展示
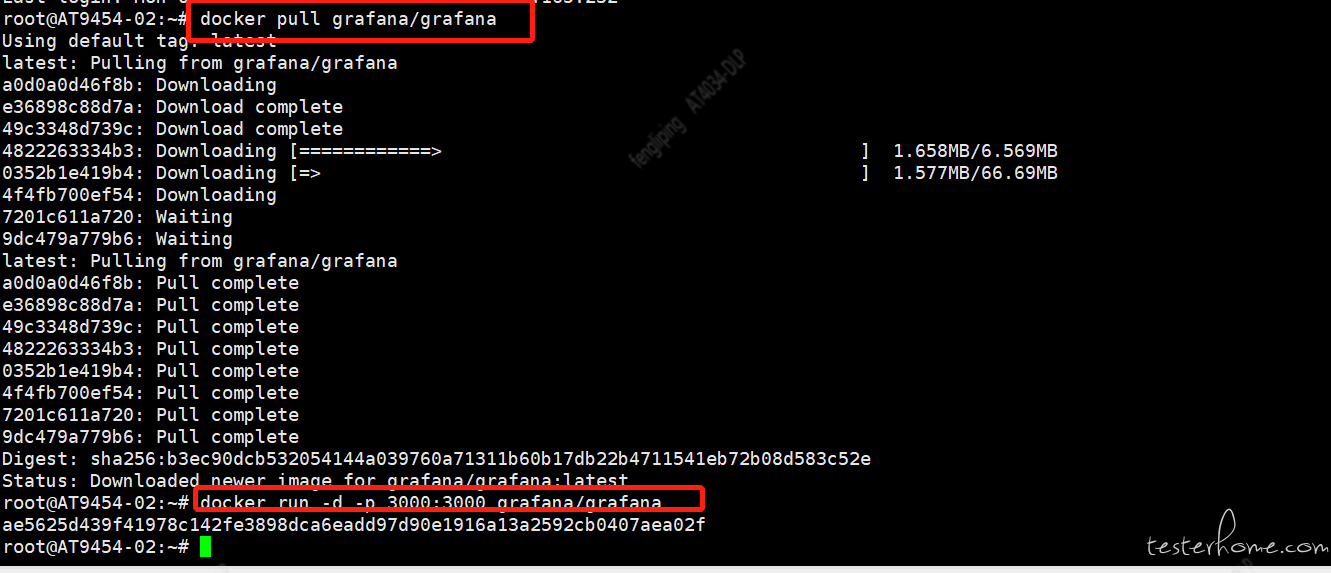
//Linux下拉取Grafana镜像
docker pull grafana/grafana
//Linux下启动镜像
docker run -d -p 3000:3000 grafana/grafana
浏览器访问
http://10.168.11.186:3000/
启动 Grafana 后,通过服务器 IP+port 打开网页,输入初始用户名和密码(admin/admin)。
五:效果展示

1.选择添加 prometheus 数据源


2.导入模板
导入模板有几种方式,选择一种方式将 dashboard 模板导入。


参考文献:
locust 性能平台(含 doker 环境)
locust 性能平台 window 下
locust 性能平台 docker
软件测试分为功能测试和
